Why LLM Inference Traffic Needs Its Own Gateway
When a customer-support summarization platform first goes live, QPS is the easiest metric to misread. The system looks like an ordinary API: the support system sends conversation records, and the model returns a summary, sentiment, action items, and QA labels. The entrypoint is /v1/chat/completions; behind it are several inference pods; Kubernetes has a gateway that forwards by connection count.
The problem appears in the second week. On Monday morning, support agents start complaining that the “generate summary” button takes too long. The backend shows GPU utilization is not fully saturated, and error rate has not obviously increased. Worse, the slowness affects only part of the traffic. Short conversations sometimes return in two seconds and sometimes hang for twenty. Long-context batch jobs that were supposed to run at night spilled over after a weekend backlog and dragged online summaries into the same queue.
This article does not repeat the abstract claim that “AI Gateway matters.” It walks through a reproducible case: how a support summarization platform on Kubernetes separates long-context batch processing from online summaries, how the gateway routes by tokens, task type, and queue state, what metrics make incidents debuggable, and how to canary, roll back, and accept the release.
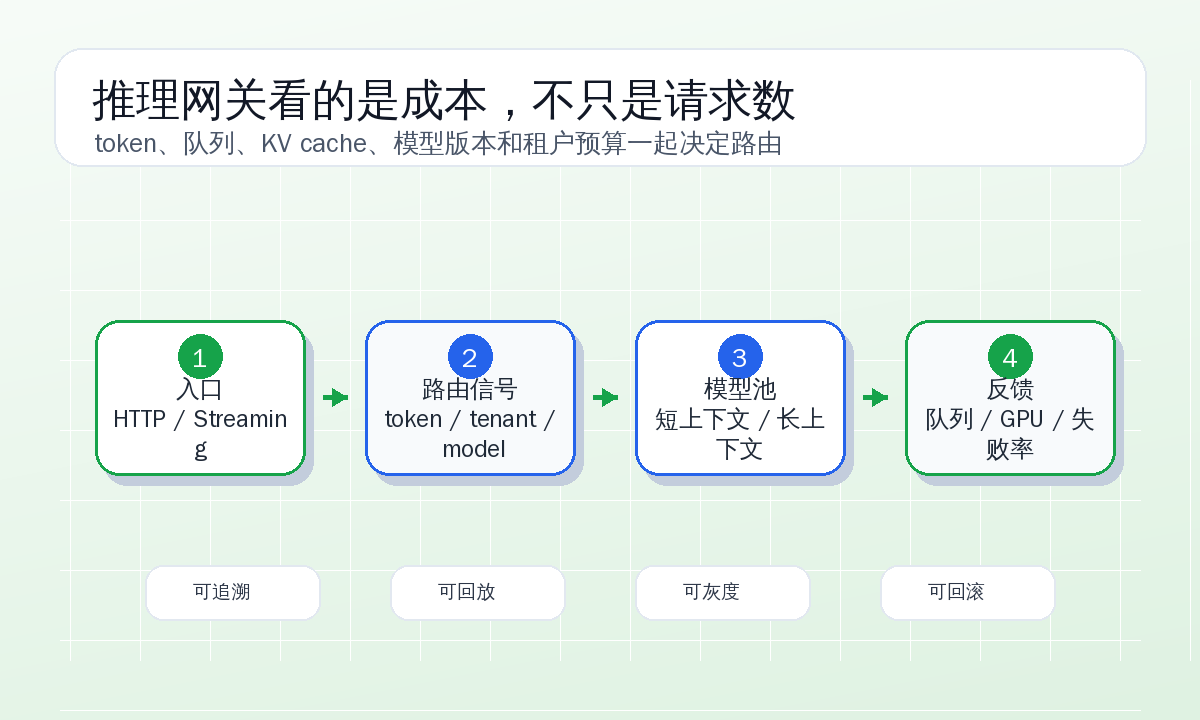
The Incident: QPS Was Not High, Long Requests Blocked the Road
The platform has two kinds of tasks. Online tasks come from the support workspace. An agent clicks “generate summary” and expects a result in a few seconds. Offline tasks come from the QA system, which recomputes summaries for the past seven days of tickets in bulk. Some conversations are very long, with inputs reaching 60K tokens. For simplicity, both kinds of requests initially hit the same model service:
client -> public gateway -> inference-gateway -> llm-summarizer-service -> vllm podsThe service has eight GPUs, four pods, and two GPUs per pod. The same long-context model handles both online and offline traffic. The gateway uses a traditional least-request strategy: send the request to the backend with fewer current connections. This works for many HTTP services, but it distorts quickly for inference services.
Here are two samples from slow requests. Fields are desensitized, but the structure keeps what real engineering work needs to care about.
{
  "request_id": "req_live_8c13",
  "tenant": "support-basic",
  "task": "live_ticket_summary",
  "model": "summary-default",
  "messages": [
    {
      "role": "system",
      "content": "Summarize the support conversation into three sections: user issue, handling progress, and next actions."
    },
    {
      "role": "user",
      "content": "<a support conversation of roughly 2800 tokens>"
    }
  ],
  "max_tokens": 420,
  "stream": false
}
{
"request_id": "req_batch_91f4",
"tenant": "quality-job",
"task": "batch_recompute_summary",
"model": "summary-default",
"messages": [
{
"role": "system",
"content": "Generate complete summaries, risk labels, support violations, and evidence references for historical tickets."
},
{
"role": "user",
"content": "<a historical conversation and knowledge-base excerpt of roughly 52000 tokens>"
}
],
"max_tokens": 1800,
"stream": false
}From the gateway’s perspective, both are POST requests. The online request has 2,800 input tokens and 420 output tokens. The batch request has 52,000 input tokens and 1,800 output tokens. Their GPU occupancy, KV-cache pressure, and prefill time are not remotely the same. A traditional gateway cannot see the difference, and queueing begins there.
The monitoring that day was misleading. Global P95 was still within 18 seconds. Error rate was below 0.3%. GPU utilization floated between 65% and 82%. What really broke was TTFT and queue time for online summaries. The user’s perception was “I clicked and nothing happened.” If you look only at average latency, it is tempting to think that adding one or two pods would solve the issue.
Before Splitting Traffic, Estimate Request Cost
We did not immediately replace the gateway or tune the Kubernetes scheduler. The first step was to let the entry layer estimate request cost. For the summarization platform, rough token estimation was enough. It did not need to perfectly match the model tokenizer. The key was knowing the request class before routing.
The entry service adds internal headers to every request, while business callers may also pass explicit task labels:
POST /v1/chat/completions HTTP/1.1
Content-Type: application/json
X-AI-Tenant: support-basic
X-AI-Task: live_ticket_summary
X-AI-Request-Class: interactive
X-AI-Trace-Id: req_live_8c13
After receiving the request, the gateway records derived fields:
{
  "trace_id": "req_live_8c13",
  "tenant": "support-basic",
  "task": "live_ticket_summary",
  "model_alias": "summary-default",
  "input_tokens_estimated": 2864,
  "output_tokens_requested": 420,
  "request_class": "interactive",
  "stream": false,
  "route_pool": "summary-online",
  "route_reason": "class=interactive,input<=8192",
  "gateway_queue_ms": 12
}
Two details matter.
First, the model name is no longer identical to a model version. The business still requests summary-default; the gateway maps it to a concrete model pool. Canary and rollback happen in the platform layer, without requiring business systems to change code.
Second, route_reason must be logged. Inference routing must not be a black-box scheduler. When something goes wrong, the team must answer: why did this request go to this pool, why did it not use fallback, why was it rate-limited, and why was it degraded?
The New Kubernetes Shape: Two Pools, Not Two Systems
The first production version was not complicated. We split the inference side into three pools, with only two hard-isolated workload classes:
| Pool | Task | Context | Strategy |
|---|---|---|---|
summary-online | Real-time summaries in support workspace | Input below 8K tokens | Protect TTFT, minimize queueing, limit output |
summary-long | Manually triggered long-conversation summaries | Input from 8K to 64K tokens | Limit concurrency, allow slower response |
summary-batch | Offline QA recomputation | Input from 8K to 64K tokens | Low-priority queue, pausable |
At the Kubernetes resource level, the online pool and the long-context pool are deployed separately. The batch pool may borrow the long-context pool at night, but it stops pulling tasks during the day when online pressure rises. This is not about perfect GPU utilization. It is about decoupling user waiting time from batch throughput.
A simplified Deployment looks like this:
apiVersion: apps/v1
kind: Deployment
metadata:
  name: summarizer-online
  labels:
    app: summarizer
    inference.pool: summary-online
spec:
  replicas: 3
  selector:
    matchLabels:
      app: summarizer
      inference.pool: summary-online
  template:
    metadata:
      labels:
        app: summarizer
        inference.pool: summary-online
    spec:
      terminationGracePeriodSeconds: 90
      containers:
        - name: runtime
          image: example.local/llm-summarizer:2026-06-15
          args:
            - "--model=/models/summary-7b"
            - "--max-model-len=8192"
            - "--served-model-name=summary-default"
          ports:
            - containerPort: 8000
          readinessProbe:
            httpGet:
              path: /health/ready
              port: 8000
            periodSeconds: 5
          resources:
            limits:
              nvidia.com/gpu: "1"
The long-context pool differs in parameters and replica count:
apiVersion: apps/v1
kind: Deployment
metadata:
  name: summarizer-long
  labels:
    app: summarizer
    inference.pool: summary-long
spec:
  replicas: 2
  template:
    metadata:
      labels:
        app: summarizer
        inference.pool: summary-long
    spec:
      terminationGracePeriodSeconds: 240
      containers:
        - name: runtime
          image: example.local/llm-summarizer:2026-06-15
          args:
            - "--model=/models/summary-14b-long"
            - "--max-model-len=65536"
            - "--served-model-name=summary-default"
            - "--max-num-seqs=8"
          resources:
            limits:
              nvidia.com/gpu: "2"
The same model alias can point to different runtimes. The online pool uses a smaller model and shorter context. The long-context pool uses a larger window. Business callers do not need to know the details; they only declare the task and input.
Gateway Rules: Explainable Is Better Than Clever
The first AI Gateway rule set was intentionally restrained. It did not try to predict each GPU’s state tens of seconds into the future. It did a few explainable things: classify by task, split by input length, protect online requests by queue time, and enforce tenant budgets.
The configuration looked like this:
apiVersion: ai.example.com/v1alpha1
kind: InferenceRoute
metadata:
  name: support-summary-route
spec:
  modelAliases:
    summary-default:
      defaultPool: summary-online
      pools:
        - name: summary-online
          service: summarizer-online.default.svc.cluster.local
          maxInputTokens: 8192
          maxOutputTokens: 600
          maxQueueMs: 800
          priority: 100
        - name: summary-long
          service: summarizer-long.default.svc.cluster.local
          minInputTokens: 8193
          maxInputTokens: 65536
          maxOutputTokens: 2200
          maxQueueMs: 12000
          priority: 50
        - name: summary-batch
          service: summarizer-batch.default.svc.cluster.local
          maxInputTokens: 65536
          maxOutputTokens: 2200
          maxQueueMs: 300000
          priority: 10
  rules:
    - name: live-summary-short
      when:
        taskIn: ["live_ticket_summary", "agent_assist_summary"]
        inputTokensLte: 8192
      routeTo: summary-online
    - name: live-summary-long
      when:
        taskIn: ["live_ticket_summary"]
        inputTokensGt: 8192
      routeTo: summary-long
    - name: quality-batch
      when:
        requestClass: batch
      routeTo: summary-batch
      queuePolicy:
        pauseWhen:
          pool: summary-online
          ttftP95MsGt: 2000
This configuration hides an important trade-off: long online requests do not squeeze into the short pool. If a user opens a very long historical ticket, it can be slower, but it must not slow every ordinary short ticket. Batch processing is even clearer: it may queue, and it may be paused.
Tenant budgets also live at the gateway layer instead of being scattered through business code:
apiVersion: ai.example.com/v1alpha1
kind: InferenceBudget
metadata:
  name: support-summary-budget
spec:
  tenants:
    - name: support-basic
      dailyInputTokens: 120000000
      dailyOutputTokens: 18000000
      concurrentRequests: 80
      maxSingleInputTokens: 12000
    - name: quality-job
      dailyInputTokens: 400000000
      dailyOutputTokens: 50000000
      concurrentRequests: 12
      maxSingleInputTokens: 65536
      allowedWindows:
        - "20:00-08:30"
Budgets are not only about cost. They protect capacity. Offline tenants cannot consume unlimited concurrency during the day, and online tenants cannot accidentally send very long conversations to the short pool. A good degradation response is not a cold 429. It should tell the caller why it failed and what path is available:
{
  "error": {
    "code": "inference_queue_paused",
    "message": "Batch queue is paused because online summary TTFT P95 exceeded the threshold.",
    "retry_after_seconds": 900,
    "route": "summary-batch",
    "fallback_options": ["retry_later", "short_summary_only"]
  }
}
Metrics: Stop Asking Only Whether the Model Is Slow
The incident became debuggable because total latency was split apart. An inference request needs at least entry, queueing, prefill, decode, transfer, and client cancellation fields. These are the fields I consider mandatory for a first version:
| Field | Meaning |
|---|---|
trace_id | Request ID across business service, gateway, and model runtime |
tenant | Tenant or caller, desensitized for budget and cost attribution |
task | Business task type, such as live summary or batch recompute |
model_alias | Model alias requested by the business |
model_version | Actual model version hit |
route_pool | Inference pool selected |
route_reason | Explanation of the routing rule |
input_tokens_estimated | Estimated tokens at entry |
input_tokens_actual | Actual tokens at runtime |
output_tokens | Actual generated tokens |
gateway_queue_ms | Queue time at gateway |
runtime_queue_ms | Internal queue time in model runtime |
prefill_ms | Input-processing time |
decode_ms | Generation time |
ttft_ms | Time to first token or first byte |
tokens_per_second | Decode throughput |
kv_cache_used_ratio | KV-cache usage ratio |
gpu_memory_used_ratio | GPU memory usage ratio |
fallback_reason | Degradation or pool-switch reason |
client_cancelled | Whether the client cancelled |
Prometheus metrics can look like this. Keep high-cardinality fields out of metric labels; trace_id belongs in logs and traces, not metrics.
ai_gateway_requests_total{pool="summary-online",task="live_ticket_summary",status="ok"} 18422
ai_gateway_route_decisions_total{pool="summary-long",reason="input_tokens_gt_8192"} 912
ai_gateway_queue_seconds_bucket{pool="summary-online",le="0.5"} 16520
ai_gateway_ttft_seconds_bucket{pool="summary-online",le="2"} 18011
ai_gateway_rejections_total{code="budget_exceeded",tenant="quality-job"} 37
ai_runtime_kv_cache_used_ratio{pool="summary-long",pod="summarizer-long-0"} 0.81
ai_runtime_prefill_seconds_bucket{pool="summary-long",le="15"} 682
Logs keep enough single-request detail:
{
  "ts": "2026-06-15T10:16:23.481+08:00",
  "trace_id": "req_live_8c13",
  "event": "inference.completed",
  "tenant": "support-basic",
  "task": "live_ticket_summary",
  "model_alias": "summary-default",
  "model_version": "summary-7b-2026-06-15",
  "route_pool": "summary-online",
  "route_reason": "rule=live-summary-short",
  "input_tokens_estimated": 2864,
  "input_tokens_actual": 2911,
  "output_tokens": 318,
  "gateway_queue_ms": 14,
  "runtime_queue_ms": 81,
  "prefill_ms": 436,
  "decode_ms": 1120,
  "ttft_ms": 612,
  "tokens_per_second": 283.9,
  "status": "ok"
}
Without these fields, the team keeps asking, “Is the model slow?” With them, the question becomes concrete: did the online pool queue grow, did long-context prefill slow down, did batch traffic steal daytime concurrency, or did a model version lose decode speed?
Debugging: From One Slow Request to the Queue
On the incident day, we investigated in four steps.
First, we sliced online-task TTFT by the time period reported by support agents. Overall P95 latency was 18 seconds, but TTFT P95 for online summaries had reached 6.4 seconds, and P99 was close to 21 seconds. The user’s “nothing happened” matched TTFT, not total generation time.
Second, we grouped by route_pool. At that time there was no separated pool, but we temporarily bucketed by input_tokens_estimated. Requests below 8K tokens saw runtime queue time grow during batch peaks. Short requests did not have slow prefill. They were slow before entering the model.
Third, we checked runtime queues and KV cache. Several pods had similar connection counts, but KV-cache usage was very different. Some pods were processing two 50K-token requests, and new short requests queued behind them. Least request looked fair but mixed heavy and light work.
Fourth, we checked batch scheduling. Weekend QA recomputation had no deadline control. As long as tasks existed, the scheduler kept submitting them. It was not wrong by itself. The platform was wrong because it gave batch traffic no low-priority lane.
After these four steps, the conclusion was clear. Scaling out could help, but it would not fix the routing problem. As long as short and long requests shared the same pool, short requests could still sit behind long ones. The real fix was entry routing and queue priority.
Release Plan: Make the Gateway a Rollback Switch
Inference-gateway changes should not cut over a large amount of traffic at once. We split the release into five stages, each with explicit exit criteria.
Stage one only labels traffic. The entry service adds X-AI-Task and X-AI-Request-Class; the gateway estimates tokens, but traffic still goes to the old service. This verifies classification accuracy and token-estimation error.
stage: shadow-label
traffic: 100%
route_effect: disabled
write_headers:
  - X-AI-Task
  - X-AI-Request-Class
  - X-AI-Input-Tokens-Estimated
Acceptance criteria: more than 95% of requests have task labels; P90 error between estimated tokens and runtime actual tokens is below 18%; unknown-task ratio is below 1%. If these do not pass, do not split traffic.
Stage two deploys the new pools without production traffic. Replay traffic and synthetic requests stress both pools. The short pool is judged by TTFT; the long pool by completion rate and memory level.
kubectl apply -f k8s/inference/summarizer-online.yaml
kubectl apply -f k8s/inference/summarizer-long.yaml
kubectl apply -f k8s/inference/inference-route-shadow.yaml
Stage three sends only 5% of short online requests to summary-online. Long-context and batch traffic stay on the old path. This stage is not about saving resources. It verifies monitoring, logs, error semantics, and timeout behavior on the new path.
canary:
  match:
    requestClass: interactive
    inputTokensLte: 8192
  percent: 5
  routeTo: summary-online
  stickyBy: tenant
Stage four expands short online traffic to 50% and sends long requests to summary-long. Batch still does not move. The online path stabilizes first; offline throughput comes later.
Stage five connects summary-batch and enables pause rules. During this stage, watch daytime online TTFT. Once it crosses the threshold, batch pauses. No debate.
Each stage carries a configuration version:
metadata:
  annotations:
    ai.example.com/route-config-version: "support-summary-2026-06-15-r3"
The version number looks trivial, but it matters during rollback. People talk about rolling back from r3 to r2, not guessing the current state from a pile of manual edits.
Rollback: Do Not Make Rollback Mean Deleting Deployments
This system has three rollback layers, and they must stay separate.
The first layer is routing rollback: send traffic back to the old service or pool while allowing in-flight requests to finish. This is the fastest rollback and usually takes effect in seconds.
kubectl patch inferenceroute support-summary-route \
  --type merge \
  -p '{"spec":{"globalMode":"legacy_passthrough"}}'
The second layer is model-alias rollback. If a new model version has output-quality problems, switch summary-default back to the old version while keeping the gateway and pools unchanged.
modelAliases:
  summary-default:
    defaultVersion: summary-7b-2026-06-10
    rollbackFrom: summary-7b-2026-06-15
The third layer is runtime rollback. Only roll back the Deployment image when pods crash, GPU memory leaks, or runtime queues behave abnormally.
kubectl rollout undo deployment/summarizer-online
kubectl rollout undo deployment/summarizer-long
Do not mix these three actions. In inference incidents, teams often panic, delete new services, restart pods, and change model names at the same time. Later, nobody can explain which step actually fixed the issue. One value of the gateway layer is that it separates traffic strategy, model version, and runtime release.
Streaming requests need additional care. Even if most summary APIs are non-streaming, a platform usually also has Q&A or generation tasks. Before a pod goes down, it must stop accepting new requests and keep enough terminationGracePeriodSeconds. The gateway must understand draining state. Otherwise, deployment itself creates half answers.
Acceptance Criteria: Do Not Use “It Feels Faster”
After release, we did not use “fewer user complaints” as the only signal. Acceptance criteria were written before rollout. The values below are examples; real systems should tune them by hardware, model, and business needs.
| Metric | Before | Acceptance line |
|---|---|---|
| Online summary TTFT P95 | 6.4s | below 1.8s |
| Online summary total latency P95 | 18s | below 7s |
| Online summary runtime queue P95 | 4.9s | below 600ms |
| Long-context summary completion rate | 94.1% | above 98% |
| Batch daytime pause effectiveness | none | effective within 5 minutes |
| Routing-log completeness | 61% | above 99% |
| Unknown-task ratio | 7.8% | below 1% |
| Rollback drill time | not tested | below 3 minutes |
Several quality checks cannot be skipped.
Online summaries must not become visibly thinner just because they moved to a short pool. We sampled 300 tickets and asked humans to judge whether “user issue, handling progress, action items, and risk labels” were complete enough, requiring the difference from the old path to stay within an acceptable range. Long-context requests must not be silently truncated; over-limit requests must return explicit errors or enter the long pool. When batch pauses, tasks must not be lost; they should only be delayed.
Cost also needs to be checked. The short pool uses a smaller model, so cost per online summary drops. The long pool is more expensive. The final decision should not look only at GPU utilization. It should check effective-summary cost, online experience, and batch completion deadline together.
What Helped Was Not the Word “Gateway”
After the change, the system shape became different. Business callers still used the same summary API, but internally the platform no longer treated every request as identical HTTP traffic. Online summaries, long-context summaries, and offline batch jobs gained different queues, model pools, budgets, and SLOs.
The useful changes were simple.
The system knows roughly how heavy a request is when it enters. Logs can explain why it was routed to a specific pool. Batch jobs no longer compete with online requests in the same queue. Model upgrades can be canaried through aliases without forcing business code releases. Rollback starts with route rollback, then decides whether model or runtime rollback is needed.
That is how I now judge whether an AI Gateway is worth building. Not by how many fancy CRDs it supports, and not by how complex its control plane is. The question is whether it helps the inference system answer production questions: why was this request slow, why did it hit this model, who is queueing, who is consuming budget, and can we move back within minutes when something goes wrong?
Traditional gateways are not wrong. LLM inference simply has a different load unit. It is not request count; it is tokens, queues, context, cache, and model version. Once those factors start shaping user experience, inference traffic deserves its own entry layer.
Follow ZiCode on WeChat
If this post was useful, you can follow later updates on WeChat as well.

X / Twitter
Follow @ax2_zicode
Faster technical notes, short thoughts, and new-post alerts are posted on X.