AI Agents Need Observability Too
One day, a “supplier health diagnosis agent” missed two low-frequency suppliers in a weekly report.
The final answer looked complete. It listed API success rates, error categories, major suppliers, week-over-week movement, and concluded that the team should “continue observing.” Business reviewers felt something was wrong. Those two low-frequency suppliers had small call volume, but one had timed out for three consecutive days, and the other had recent authentication failures. By the manual investigation standard, both should have entered the risk list.
If you look only at the agent’s final answer, it is almost impossible to tell where it failed. There was no exception. HTTP status was 200. The model did not obviously hallucinate. It simply under-counted quietly.
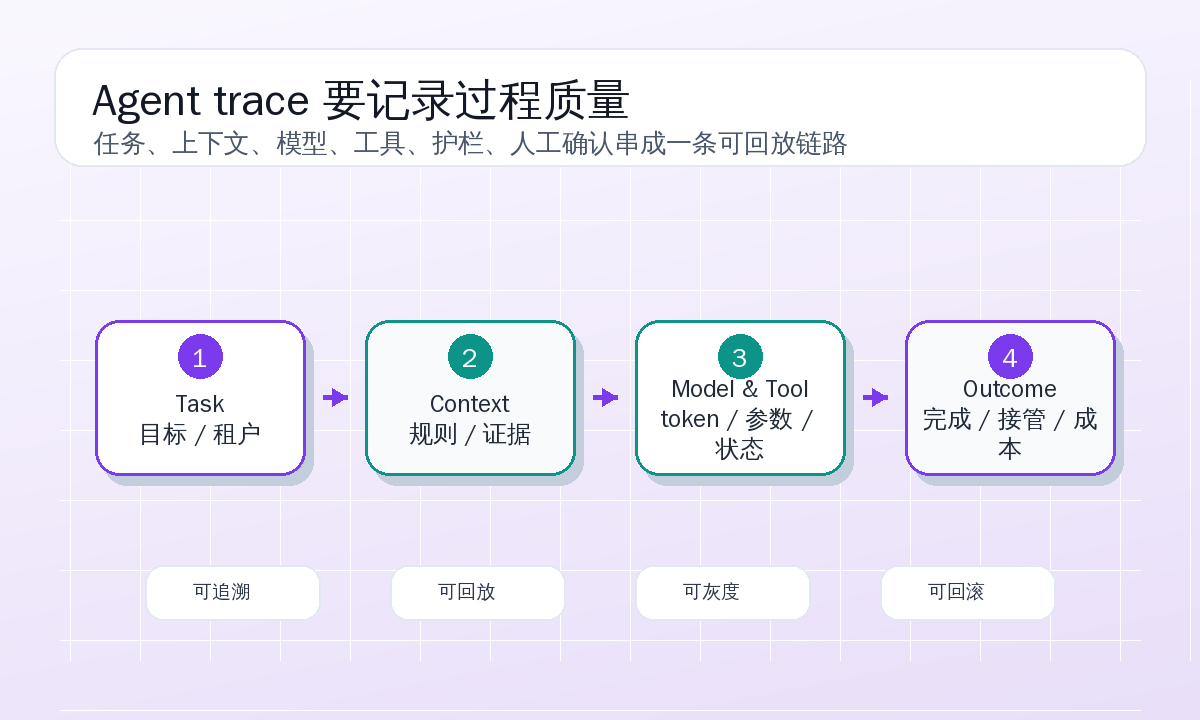
That kind of issue made me more convinced that observability is not a nice-to-have after agents enter production. Without a trace, you are watching an edited video. With a trace, you can see what the agent saw, what it skipped, what tools returned, how errors were classified, and why the final conclusion was written.
A Realistic Missed-Case Record
The agent’s job was not flashy. Every morning, given a time window, it calls internal monitoring tools to fetch supplier-level call volume, success rate, error type, latency percentiles, and recent abnormal samples. Then it generates a diagnosis so operations and technical-support teams can quickly see which suppliers need follow-up.
The product description said:
Input: time range, business line, supplier set, or default all suppliers.
Output: supplier health tiers, abnormal reasons, recommended actions,
        and samples requiring manual review.
Success criteria: cover all suppliers with calls or errors in the time window;
                  do not miss high-risk suppliers;
                  distinguish client parameter errors, supplier failures,
                  platform internal failures, and permission issues.
On the incident day, the user asked: “Check supplier health over the past seven days and highlight what needs follow-up.” The agent produced an overview of 12 suppliers, with three yellow warnings and no red high-risk supplier. Manual review found that 14 suppliers had records in the window. The two missed ones were:
| supplier_id | 7-day calls | Abnormality | Manual judgment |
|---|---|---|---|
supplier_delta | 18 | 9 timeouts concentrated in the past 3 days | Low volume but high risk; should be red |
supplier_kappa | 7 | 5 authentication failures | Needs responsibility attribution |
This is not the kind of ordinary service failure where an API returns 500. Any step in the agent may be wrong. It may not have queried low-frequency suppliers. It may have retrieved them and then dropped them during summarization. It may have treated a tool error as an empty result. It may have decided that low call volume was not worth mentioning. It may have classified authentication failures as client-parameter errors and removed them from supplier risk.
Without traces, debugging becomes guessing.
A Trace Should Answer Four Questions First
I do not like starting with “what should an agent observability platform look like?” During an incident, a trace first needs to answer four plain questions:
- What did the system think the task was?
- What context and data did it see?
- Which tools did it call, and what did those tools actually return?
- Why did it include some results in the conclusion and drop others?
The most important part of that incident trace looked like this:
{
  "trace_id": "tr_health_20260408_091522",
  "task": {
    "task_type": "supplier_health_diagnosis",
    "tenant_hash": "tn_redacted_42",
    "requested_window": {
      "from": "2026-04-01T00:00:00+08:00",
      "to": "2026-04-08T00:00:00+08:00"
    },
    "business_line": "default",
    "success_criteria": [
      "cover_all_suppliers_with_calls_or_errors",
      "flag_high_risk_even_when_volume_is_low",
      "separate_auth_error_from_provider_5xx"
    ]
  },
  "outcome": {
    "agent_reported": "completed",
    "reviewed": "partial",
    "review_reason": "missed_low_frequency_suppliers"
  }
}
If success_criteria is missing from the task, it becomes hard to decide whether missing low-frequency suppliers is actually a failure. Many agent systems have their first observability gap here: they log what the user said, but not what the system interpreted the task to mean.
The Tool Call Did Not Fail, but the Parameters Were Wrong
The first issue appeared during query. The agent’s first call to the supplier metrics tool was:
{
  "span_id": "sp_002",
  "span_type": "tool_call",
  "tool_name": "supplier_metrics.query",
  "step_index": 2,
  "input_summary": {
    "window_days": 7,
    "business_line": "default",
    "min_calls": 20,
    "include_error_only": false,
    "group_by": ["supplier_id"]
  },
  "output_summary": {
    "status": "ok",
    "row_count": 12,
    "latency_ms": 842,
    "truncated": false
  },
  "error": null
}
The API succeeded. The problem was min_calls: 20 and include_error_only: false. These values came from tool-schema defaults originally intended to filter noise in daily overview dashboards. But this task was health diagnosis, and the success criteria clearly said “low-frequency high-risk suppliers must still be flagged.” The agent did not override the defaults, so the tool filtered out two suppliers.
If logs say only “called supplier_metrics.query and returned 12 rows,” this is hard to find. The trace must record parameter summaries, especially parameters that affect coverage. Full raw parameters may not always be loggable, but diagnostic fields like min_calls, include_error_only, window_days, and group_by must be visible.
We later added coverage_policy to tool-call spans:
{
  "coverage_policy": {
    "intended": "all_suppliers_with_calls_or_errors",
    "actual_filters": {
      "min_calls": 20,
      "include_error_only": false
    },
    "coverage_risk": "may_drop_low_frequency_suppliers"
  }
}
This field is not something the model freely writes. The tool wrapper generates it from parameter rules. A dashboard can then count tasks with coverage risk directly, without waiting for business users to notice missing rows.
Context Compaction Removed a Critical Constraint
The second problem was context. Before each task, this agent injects system rules, business definitions, error taxonomy, the previous weekly report summary, and tool-schema summaries. To save tokens, it has a context compactor that compresses long rules.
The context span on the incident day was:
{
  "span_id": "sp_001",
  "span_type": "context",
  "step_index": 1,
  "context_refs": [
    {
      "ref_id": "rule_supplier_health_v3",
      "title": "Supplier health diagnosis rules",
      "version": "2026-03-20",
      "included_tokens": 412,
      "compression": "summary"
    },
    {
      "ref_id": "taxonomy_error_v5",
      "title": "Error classification definitions",
      "version": "2026-03-28",
      "included_tokens": 368,
      "compression": "summary"
    },
    {
      "ref_id": "weekly_report_2026_04_01",
      "title": "Previous supplier weekly report",
      "included_tokens": 530,
      "compression": "full_summary"
    }
  ],
  "dropped_context_refs": [
    {
      "ref_id": "rule_supplier_low_volume_exception",
      "reason": "token_budget",
      "priority": "medium"
    }
  ]
}
The second trap is already visible: rule_supplier_low_volume_exception was dropped. That rule said: when a supplier has fewer than 20 calls but an error rate above 40%, or the same error appears for three consecutive days, it must enter manual review. It had been marked medium priority, so the compactor kept the previous weekly report and dropped a rule needed for the current diagnosis.
This is easily misdiagnosed as “the model did not follow the rule.” In reality, the model never saw the rule. In agent observability, context is not a blob of prompt. It is an auditable set of references: which rules were injected, which were compressed, which were dropped, and why.
We later changed context priority. Task success criteria and safety or coverage rules always outrank historical summaries. Historical summaries are background and must not push out constraints. The trace also gained required_context_missing:
{
  "required_context_missing": [
    {
      "ref_id": "rule_supplier_low_volume_exception",
      "impact": "coverage",
      "should_block": true
    }
  ]
}
When this field appears, the agent should not continue generating a complete report. It should degrade to “data coverage is incomplete; re-query or manual review is needed.”
Error Classification Matters More Than Exception Stack Traces
The other missed supplier, supplier_kappa, was not lost only because of min_calls. Its five authentication failures came from another tool, supplier_errors.search. The tool returned data, but the agent rewrote the error classification internally.
The tool span was:
{
  "span_id": "sp_005",
  "span_type": "tool_call",
  "tool_name": "supplier_errors.search",
  "input_summary": {
    "window_days": 7,
    "supplier_ids": ["supplier_alpha", "supplier_beta", "supplier_kappa"],
    "error_types": ["timeout", "auth", "5xx", "schema"]
  },
  "output_summary": {
    "status": "ok",
    "row_count": 31,
    "error_class_counts": {
      "provider_timeout": 12,
      "provider_5xx": 4,
      "auth_failed": 5,
      "client_schema_error": 10
    }
  }
}
The later decision span said:
{
  "span_id": "sp_007",
  "span_type": "decision",
  "decision_type": "risk_classification",
  "input_refs": ["sp_005"],
  "model_rationale_summary": "auth_failed usually indicates client-side credential configuration; do not classify as provider health risk unless provider-wide pattern exists.",
  "classified_counts": {
    "provider_risk": 16,
    "client_issue": 15
  },
  "dropped_suppliers": [
    {
      "supplier_id": "supplier_kappa",
      "reason": "classified_as_client_issue"
    }
  ]
}
This rationale is not entirely wrong. Authentication failure may indeed be caused by client configuration. But the product goal is supplier health diagnosis, not only supplier-side 5xx. If a supplier’s authentication failures suddenly concentrate, it may be a provider credential-rule change, certificate expiration, callback configuration change, or platform-side synchronization issue. The right behavior is not to remove it from risk, but to put it into “responsibility unclear, needs review.”
Tool errors therefore need more than exceptions. They need stable classification and attribution fields:
| Field | Example | Why it matters |
|---|---|---|
raw_error_class | auth_failed | Original tool or log classification |
normalized_error_class | authentication | Cross-tool taxonomy |
attribution_candidate | client_or_provider_config | Responsibility is uncertain |
confidence | 0.62 | Low confidence requires review |
action_policy | include_in_review | Determines report inclusion |
After the fix, auth_failed was no longer automatically classified as client issue. Only clear evidence, such as the same client failing against many suppliers or a recent credential-id change in samples, can downgrade it. Otherwise, it enters review.
Dashboards Are Not for Showing Averages to Managers
After this incident, the agent dashboard became a debugging entrypoint rather than a reporting page. The first screen contains metrics that guide investigation:
| Metric | Meaning |
|---|---|
task_outcome | completed, partial, needs_review, failed, refused |
supplier_coverage_rate | Suppliers reported / suppliers with calls or errors |
low_volume_high_risk_missed | Missed low-volume high-risk suppliers |
tool_filter_risk_count | Tool filters that may affect coverage |
required_context_missing_count | Missing required context |
error_attribution_unknown_rate | Uncertain responsibility forced into a class |
manual_review_queue_size | Suppliers or samples needing manual review |
cost_per_completed_task | Model and tool cost per completed task |
Every field links to traces. If low_volume_high_risk_missed rises, clicking it should show tasks with time window, supplier count, tool-filter parameters, dropped context, and whether the final report included a review list. An on-call engineer should be able to open one task and see why min_calls was 20.
For ordinary services, P95 latency and error rate are natural. For agents, process quality matters too. A sudden rise in step count may mean planning loops. More tool-parameter repair may mean schema descriptions have degraded. More missing context may mean token budget is being eaten by history. Higher task cost may mean retry loops or overlong reports. An agent’s health cannot be explained by HTTP 200.
Release Gates Should Catch Quiet Regressions
Agents often get worse quietly. A stronger model may write prettier reports. A more aggressive prompt may produce more recommendations. A higher default filter may make reports shorter and cleaner. But low-frequency anomalies disappear, uncertain errors become overconfident conclusions, and high-risk cases fail to enter review.
So release gates should focus on task facts rather than prose quality. The supplier-health agent now has fixed regression cases:
{
  "case_id": "supplier_health_low_volume_003",
  "input": {
    "window_days": 7,
    "business_line": "default",
    "request": "Check supplier health over the past seven days and highlight what needs follow-up"
  },
  "fixture": {
    "suppliers": [
      {"supplier_id": "supplier_alpha", "calls": 1280, "errors": 13, "dominant_error": "provider_5xx"},
      {"supplier_id": "supplier_delta", "calls": 18, "errors": 9, "dominant_error": "provider_timeout"},
      {"supplier_id": "supplier_kappa", "calls": 7, "errors": 5, "dominant_error": "auth_failed"}
    ]
  },
  "expected": {
    "must_include_suppliers": ["supplier_delta", "supplier_kappa"],
    "must_include_review_reasons": {
      "supplier_delta": "low_volume_high_error_rate",
      "supplier_kappa": "auth_error_attribution_uncertain"
    },
    "must_not_claim": [
      "no high risk supplier",
      "auth failures are client-only"
    ],
    "required_trace_assertions": [
      "supplier_metrics.query.input_summary.include_error_only == true",
      "supplier_metrics.query.input_summary.min_calls == 0",
      "context.required_context_missing is empty",
      "decision.dropped_suppliers does not include supplier_delta"
    ]
  }
}
The important part is not just the final wording. It is the trace assertion. If tool parameters slip back to min_calls: 20, the gate fires even if the model happens to mention supplier_delta by luck. Production cannot depend on luck.
The release table also avoids a single pass rate:
| Gate | Threshold | Failure action |
|---|---|---|
| High-risk supplier missed | 0 | Block release |
| Required context missing | 0 | Block release |
| Tool coverage risk not degraded | 0 | Block release |
| Forced attribution of uncertain errors | < 1% | Canary with manual sampling |
| Task completion regression | no worse than online by 1% | Canary |
| P95 step-count growth | no more than 20% | Performance review |
| Cost per task growth | no more than 15% | Cost review |
One detail matters: task_outcome may be needs_review. The agent does not have to conclude everything automatically. For low-frequency high-risk cases, unclear responsibility, or incomplete data coverage, the correct behavior is to put samples into manual review with reasons. If that handoff is counted as failure, the system will be incentivized to bluff.
Cost Problems Hide in Traces Too
While fixing the missed suppliers, we found another issue: some tasks were expensive. The average diagnosis used three model calls, but P95 reached 11. Trace inspection showed that when error classification was uncertain, the agent repeatedly asked the model to debate whether it was a client or supplier issue, without adding new data.
A cost summary looked like this:
{
  "trace_id": "tr_health_20260410_083011",
  "cost_summary": {
    "model_calls": 9,
    "tool_calls": 4,
    "input_tokens": 28430,
    "output_tokens": 6120,
    "estimated_cost_usd": 0.74
  },
  "loop_summary": {
    "repeated_decision_type": "risk_classification",
    "iterations": 5,
    "new_evidence_after_first_iteration": false,
    "stop_reason": "max_iteration"
  }
}
The cost problem was not model price. It was process design. Repeated reasoning without new evidence should stop and turn into needs_review. We added a rule: the same classification decision can retry at most once without new tool results; low confidence should not trigger self-debate, but produce review reason.
Agent cost optimization cannot look only at invoices. It needs breakdown by task, step, tool, model version, and retry reason. The most expensive 1% of tasks are often not truly complex; they lack exit conditions.
Sampling Must Not Drop What You Most Need
Some teams reduce trace cost by sampling 1%. That may be acceptable for ordinary high-frequency APIs. It is dangerous for agents because the samples you most need are often low-frequency, high-risk, complained-about, manually handed off, policy-blocked, or cost-abnormal. Random sampling may miss exactly those.
The supplier-health agent now uses this retention policy:
| Task type | Trace retention |
|---|---|
| Normal completion and low risk | Full structured summary, detailed spans sampled |
partial or needs_review | Full detailed spans |
| High-risk supplier related | Full detailed spans |
| User feedback says wrong | Raw context short-term, desensitized long-term |
| Tool abnormality or coverage risk | Full detailed tool spans |
| Cost top 1% | Full detailed spans |
The principle is simple: save on normal samples, not on failures or high-risk samples. Privacy must be designed together. Logs store structured summaries, IDs, hashes, counts, and classes by default. Raw tool results are short-lived and permissioned. Traces exported to review or evaluation sets must be redacted.
Observability is not “store every prompt and response.” That is both expensive and dangerous. What matters is preserving structured facts that can reconstruct decisions.
OpenTelemetry Is the Skeleton; Business Fields Are the Flesh
OpenTelemetry’s trace and span structure is a good fit for agent processes. GenAI semantic conventions also standardize model name, tokens, latency, stop reason, request type, and similar fields. But generic fields are not enough. In this supplier-health case, the fields that located the issue were business fields:
| Span | Generic fields | Business fields |
|---|---|---|
| task | trace_id, duration, status | task_type, success_criteria, business_line |
| context | input token, context size | required_context_missing, context_refs, dropped_context_refs |
| tool_call | tool_name, latency, status | min_calls, include_error_only, coverage_policy |
| model_call | model, tokens, stop_reason | decision_type, confidence, new_evidence_refs |
| decision | span links, attributes | dropped_suppliers, attribution_candidate, action_policy |
| outcome | status, error | task_outcome, manual_review_items, missed_high_risk_count |
That is my basic view of agent observability: tool-level standards matter, but each business agent must define its own success criteria and key fields. Without business fields, a trace can only say “the model was called nine times.” With them, it can say “the default min_calls parameter dropped low-frequency high-risk suppliers.”
Failed Samples Should Become Evaluation Cases
The missed-supplier incident became a fixed evaluation case named supplier_health_low_volume_003. Every prompt change, tool-schema change, context-compaction change, or model swap now runs against it. Evaluation checks not only the final report but also the trace.
An evaluation record looks like this:
| Field | Content |
|---|---|
case_id | supplier_health_low_volume_003 |
input_request | Supplier health diagnosis for the past seven days |
fixture_version | 2026-04-low-volume-v2 |
expected_suppliers | supplier_delta, supplier_kappa |
expected_outcome | completed_with_review_items |
trace_assertions | Do not filter low volume; required context present; uncertain attribution preserved |
answer_assertions | Do not claim no high risk; must explain review reasons |
risk_level | high |
owner | agent_platform |
This turns the incident from a one-time lesson into a durable guardrail. If the same issue returns, the gate catches it.
I prefer this “trace to evaluation” loop over a separate idealized benchmark. Real failures carry noise, boundaries, and awkward phrasing. That is exactly what protects production.
Trace Forces Product Boundaries to Be Clear
After this review, the product document changed too. Previously, “supplier health diagnosis” sounded like the agent always gives a conclusion. It is now split into three outputs:
confirmed_risk: evidence is enough to mark red or yellow.needs_review: data is abnormal but responsibility is uncertain.insufficient_data: tool failure, missing context, or incomplete coverage prevents a full conclusion.
All three outcomes are normal. confirmed_risk is not the only success. Agent observability forces product language to become precise: what counts as complete, what counts as partial, when the system must stop, and when it should recommend manual review. Without clear boundaries, traces fill with completed while the business keeps feeling the task was not completed.
This is different from traditional APIs. HTTP 200 means the service returned. It does not mean the agent task was truly completed. Task state must be defined separately.
Questions I Ask Before Production
When an agent is heading toward production, I ask about observability before asking how strong the model is.
Does it have stable task_id and trace_id? Do task success criteria enter the trace? Can context injection show references, versions, compression, and dropped reasons? Are tool parameters that affect coverage and permission visible? Are tool errors structurally classified? Do important model decisions have input references and confidence? Is human handoff a first-class outcome? Can cost be broken down by step? Can failed samples enter the evaluation set? Do release gates check traces instead of only final answers?
These questions sound tedious, but they come from real production problems. Agents do not always crash when they fail. They may under-count, misattribute, wander, become overconfident, swallow tool errors, or turn uncertainty into certainty. The prettier the final answer, the easier it is to hide the process problem.
The supplier-health fix was not mystical: tool default parameters became explicit by task type; the low-frequency high-risk rule became required context; authentication failures with uncertain responsibility moved to review; traces gained coverage-risk, missing-context, and attribution fields; dashboards linked to samples; release gates added trace assertions. None of that requires magic. It requires seeing the process.
Agent observability is not about having more logs. It is about reconstructing the chain of facts behind a conclusion. If you can reconstruct it, you can classify, fix, and regress the issue. If you cannot, every incident becomes a new guessing game.
References
- OpenTelemetry GenAI Semantic Conventions
- OpenTelemetry GenAI Semantic Conventions Repository
- OWASP Top 10 for LLM Applications
Follow ZiCode on WeChat
If this post was useful, you can follow later updates on WeChat as well.

X / Twitter
Follow @ax2_zicode
Faster technical notes, short thoughts, and new-post alerts are posted on X.